
Auto Insurance
Are Americans Slowing Down? Annual Speeding Crashes, Fatalities Decline 10% in Past Decade
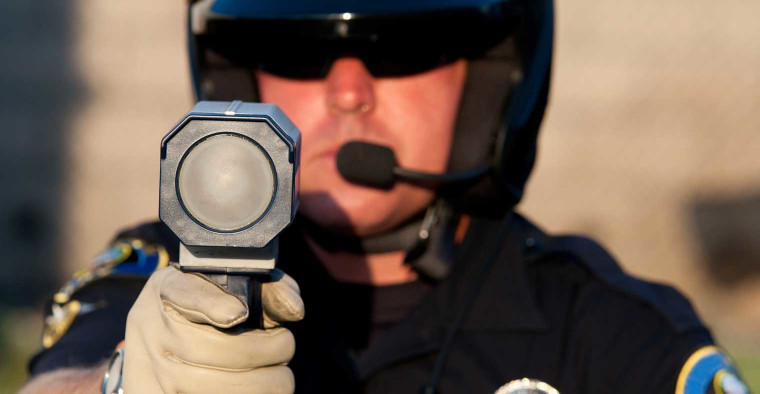
The cost of speeding goes beyond ticket fines and fees. ValuePenguin compared the cost of car insurance before and after a driver committed a speeding violation, discovering that rates increase by an average of 22% across the U.S. because of that ticket.
And these rates increase by varying amounts, depending on the state. In California, where insurers are limited in how they set rates, average costs increase by nearly half (49%) after a speeding violation. Speeding drivers in Texas, however, are likely to see average rate hikes of just 7%, despite the state having the most speeding-related fatal crashes and deaths in the U.S.
All this said, the number of per-year crashes and fatalities dropped by 10% in the past decade. Annual fatalities fell from 10,508 in 2010 to 9,478 in 2019 — the latest available data. At the same time, speeding-related crashes were just as deadly in 2019 as in 2010. For every 100 fatal speeding-related crashes, 111.1 people died in 2010, compared with 110.9 in 2019.
Key findings
- Speeding is most expensive in California and least expensive in Texas. Car insurance rates increase by an average of 49% after a speeding violation in California, and by just 7% in Texas. Across the U.S., average rates go up by 22% for a speeding driver.
- Texas has the highest number of speeding-related fatal crashes and deaths. From 2010 to 2019, 10,209 deadly speeding crashes resulted in 11,444 deaths. Texas was the only state with more than 10,000 crashes.
- Nearly half of crash deaths in New Hampshire are attributable to speeding, the most in the nation. Speeding is a factor in 48% of roadway fatalities in the state. At the same time, a similar percentage (47%) of fatal crashes in New Hampshire are related to speeding.
- The number of yearly fatalities related to speeding dropped by 10% in the past decade. There were 10,508 killed in speeding-related crashes in 2010, compared with 9,478 in 2019.
A speeding violation results in a 22% increase, on average, to the cost of car insurance — though the markup can be as high as 49% depending on the state
Auto owners without clean driving records can pay hundreds of dollars more a year than counterparts without accidents or violations. While the cost of coverage increases by an average of 46% after a crash, rates go up by 22% on average after a speeding violation. However, depending on the state, the change to car insurance premiums after a speeding violation can be much higher or lower.
In California, the increase after a speeding violation is higher than in other states. Average rates in California increase by 49% for a driver with speeding on their record. This may be due to the strict rules insurance providers in California must follow when setting rates. Insurers in the state may not, for example, use certain nondriving characteristics to set rates, including credit scores. More weight, as a result, may be put onto driving history.
The effects of speeding may be even worse in Michigan. There, the average cost of coverage increases by 10 percentage points less (39%) than in California. However, Michigan still has the second-highest rate change after a speeding violation. And the high average cost of coverage in Michigan produces an average premium increase of $3,494 a year after a violation — the highest gross change of any state, by far.
Rank | State | Before speeding | After speeding | Change |
|---|---|---|---|---|
| 1 | California | $1,817 | $2,699 | 49% |
| 2 | Michigan | $9,071 | $12,565 | 39% |
| 3 | North Carolina | $1,506 | $2,076 | 38% |
| 4 | Massachusetts | $2,158 | $2,907 | 35% |
| 5 | Arizona | $3,071 | $3,933 | 28% |
| 6 | Oregon | $2,332 | $2,977 | 28% |
| 7 | Kentucky | $2,907 | $3,707 | 28% |
| 8 | Illinois | $2,218 | $2,827 | 27% |
| 9 | Alabama | $1,870 | $2,360 | 26% |
| 10 | Maine | $1,286 | $1,605 | 25% |
| 11 | Colorado | $3,120 | $3,892 | 25% |
| 12 | Wyoming | $2,123 | $2,648 | 25% |
Rates are displayed as yearly premiums.
The cost increase after a speeding violation is lowest in Texas, on average. The cost of coverage in Texas goes up by an average of 7% after a speeding ticket. The Lone Star State is one of two states where rates increase by less than 10% after a speeding violation (the other being North Dakota).
Texas has the highest number of speeding-related fatal crashes and deaths, though other states may be more dangerous depending on the measurement
While car insurance rates after speeding increase less in Texas than in other states, fatal crashes and deaths related to speeding are most common in the state. In fact, according to data from 2010 to 2019 — the most recently available — speeding-related fatal crashes were the highest in Texas.
During this period, there were 11,444 deaths from 10,209 speeding-related crashes in Texas.
There are a few other states like Texas where a high number of speeding-related fatal crashes and deaths doesn’t correspond to high insurance rate increases. New York had the ninth-most fatal crashes related to speeding from 2010 to 2019, but its average markup is third to last (10%). Pennsylvania, where insurance costs 12% more after a speeding violation (47th in the U.S.), had the third-most fatal crashes due to speeding during this time.
State | Rank for crashes | Crashes | Rank for cost increase | Change |
|---|---|---|---|---|
| Texas | 1 | 10,209 | 50 | 7% |
| California | 2 | 9,171 | 1 | 49% |
| Pennsylvania | 3 | 4,904 | 46 | 12% |
| North Carolina | 4 | 4,043 | 3 | 38% |
| Illinois | 5 | 3,702 | 8 | 27% |
| South Carolina | 6 | 3,299 | 23 | 20% |
| Florida | 7 | 2,921 | 15 | 23% |
| Missouri | 8 | 2,898 | 19 | 22% |
| New York | 9 | 2,882 | 48 | 10% |
| Arizona | 10 | 2,661 | 5 | 28% |
| Ohio | 11 | 2,591 | 42 | 14% |
| Alabama | 12 | 2,401 | 9 | 26% |
States are ordered from lowest to highest for number of fatal crashes due to speeding.
While Texas has the highest number of fatal crashes and deaths from speeding, New Hampshire is a more deadly state by another metric. In New Hampshire, speeding was more likely than in other states to have played a part in deaths. Of all roadway deaths, 48% in New Hampshire were related to speeding (for comparison, the share of deaths related to speeding was 33% in Texas). At the same time, 47% of fatal car crashes in New Hampshire were related to speeding — also the highest share compared to other states.
The lowest share of deaths related to speeding belonged to Florida. Of 27,720 roadway deaths, 12% were attributable to speeding.
Rank | State | Percentage speeding | Deaths per 100 fatal crashes |
|---|---|---|---|
| 1 | New Hampshire | 48% | 108.9 |
| 2 | Hawaii | 46% | 111.2 |
| 3 | Pennsylvania | 45% | 110.1 |
| 4 | Rhode Island | 44% | 109.0 |
| 5 | Illinois | 41% | 111.0 |
| 6 | South Carolina | 39% | 108.7 |
| 7 | Vermont | 39% | 116.4 |
| 8 | Maine | 38% | 112.7 |
| 9 | Alaska | 38% | 112.6 |
| 10 | Missouri | 38% | 110.9 |
| 11 | New Mexico | 37% | 115.0 |
| 12 | Colorado | 36% | 112.2 |
States are ordered by the share of automobile deaths related to speeding.
Also, despite the highest number of deaths and fatal crashes related to speeding occurring in Texas, the state didn’t have the highest rate of fatalities per crash. Instead, more people were likely to be killed by a single crash in Vermont, with 116.4 deaths per 100 fatal speeding-related crashes. The rate in Texas during this period was 112.1 deaths per 100 crashes — slightly higher than the national rate of 111.2 per 100.
The number of fatalities per year caused by speeding-related crashes dropped by 10% in the past decade, but the number of deaths per accident remained virtually the same
The number of yearly fatal crashes and deaths related to speeding has lessened over the past decade. In 2019, there were 10% fewer deaths from speeding (9,478) than in 2010 (10,508). The number of fatal crashes caused by speeding also fell — by 10%, too.
During this time, however, the same drop wasn’t observable in the rate of people killed in a fatal speeding-related crash. Over the decade, the rate of fatalities per 100 fatal crashes was steady — 111.1 deaths per 100 speeding-related crashes fell to 110.9 deaths.
Year | Deaths | Change | Crashes | Change | Rate |
|---|---|---|---|---|---|
| 2010 | 10,508 | -- | 9,462 | -- | 111.1 |
| 2011 | 10,001 | -5% | 8,988 | -5% | 111.3 |
| 2012 | 10,329 | 3% | 9,274 | 3% | 111.4 |
| 2013 | 9,696 | -6% | 8,730 | -6% | 111.1 |
| 2014 | 9,283 | -4% | 8,289 | -5% | 112.0 |
| 2015 | 9,723 | 5% | 8,706 | 5% | 111.7 |
| 2016 | 10,291 | 6% | 9,262 | 6% | 111.1 |
| 2017 | 9,947 | -3% | 8,955 | -3% | 111.1 |
| 2018 | 9,579 | -4% | 8,632 | -4% | 111.0 |
| 2019 | 9,478 | -1% | 8,544 | -1% | 110.9 |
| Total | 98,835 | -10% | 88,842 | -10% | 111.2 |
Methodology
ValuePenguin analyzed data related to fatal crashes and deaths related to speeding from the National Highway Traffic Safety Administration's Fatality Analysis Reporting System (FARS). Researchers focused on figures from 2010 to 2019 — the most recently available federal data.
Also, ValuePenguin gathered auto insurance quotes from every county in the U.S. for a full coverage policy for a driver with and without a speeding violation on their record. The ValuePenguin analysis used insurance rate data from Quadrant Information Services. These rates were publicly sourced from insurer filings and should be used for comparative purposes only, as your quotes may be different.