Health Insurance
COVID-19 Vaccinations Rebound Slightly Nationwide as Flu Rates Stagnate — Plus a State-by-State Look
With winter here, sickness season is in full swing. But if recent history is any indication, not everyone’s getting vaccinated against circulating viruses.
According to a ValuePenguin analysis, less than half (46.7%) of adults 18 and older got the flu shot during the 2024-25 season, while less than a quarter (23.0%) were vaccinated against COVID-19.
Meanwhile, other nations are declaring flu epidemics and fearing that this season's mutation could cause the "worst season in a decade." We take a state-by-state and national look at vaccination rates.
On this page
- Key findings
- COVID-19, flu vaccination rates similar between 2023-24, 2024-25 seasons
- District of Columbia had highest COVID-19, flu vaccination rates
- Louisiana had lowest COVID-19 vaccination rate, while Florida had lowest flu vaccination rate
- COVID-19 vaccination rates fell across South
- Flu vaccination rates grew most in Mississippi
- Getting jabbed as the flu makes its rounds: Top expert tips
- Methodology
Key findings
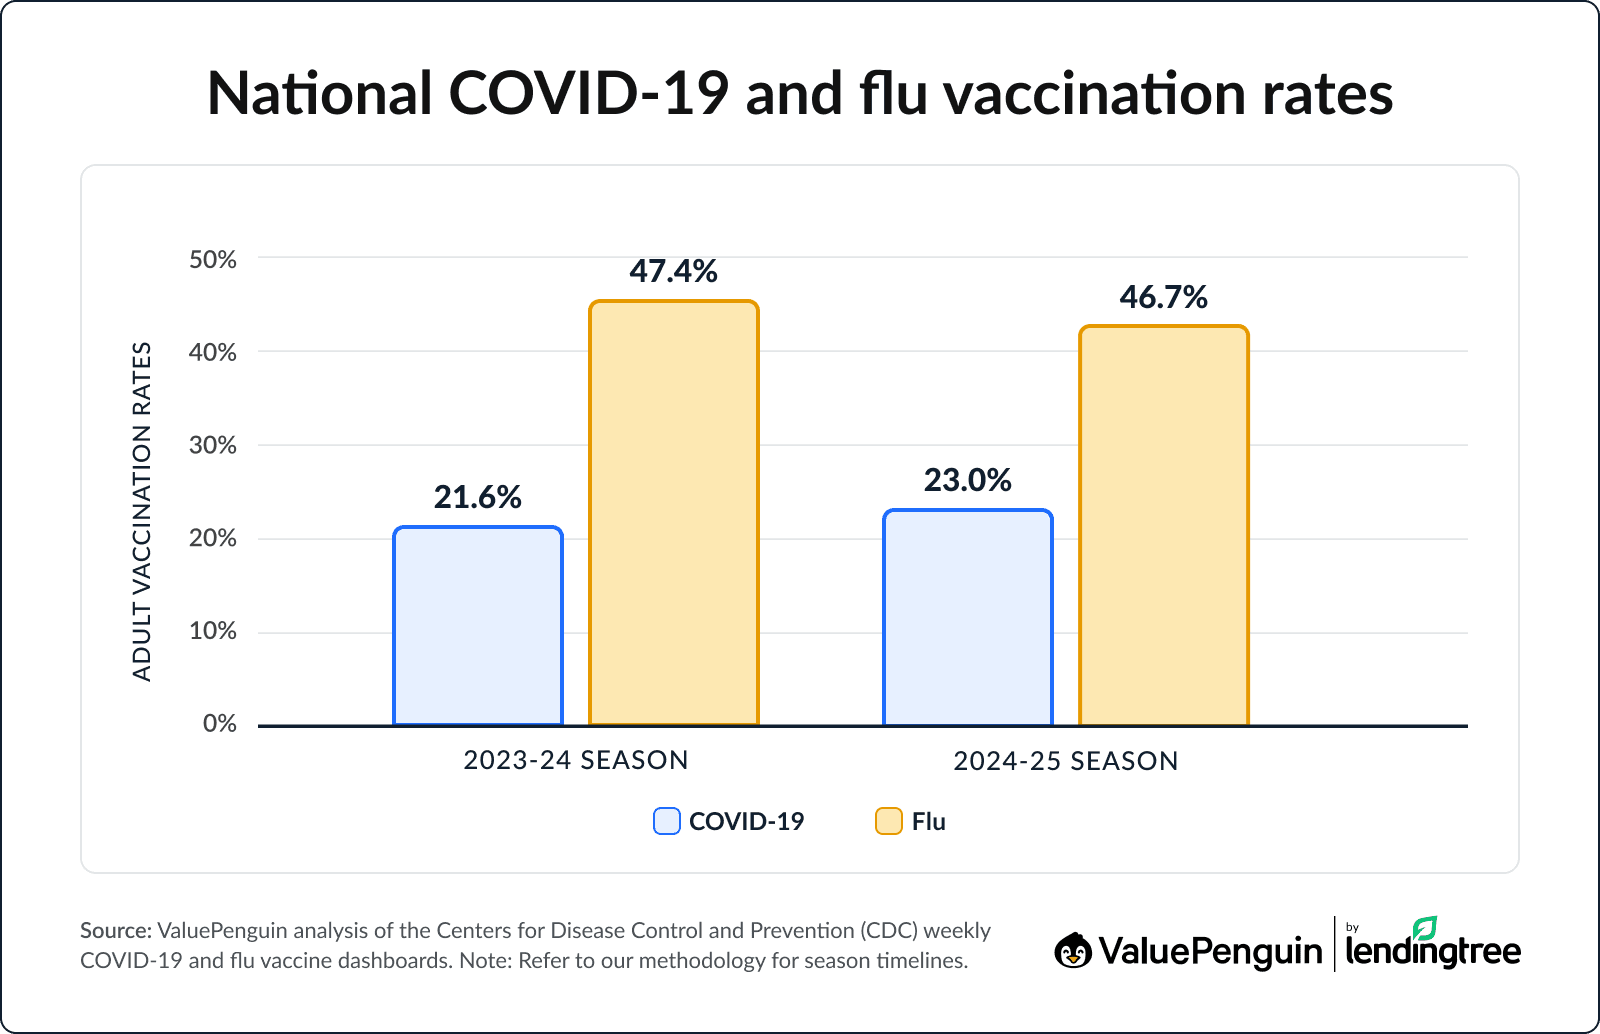
- According to the latest available federal data, 23.0% of adults 18 and older got the COVID-19 vaccine and 46.7% got the flu vaccine during the 2024-25 season. These figures were up from 21.6% for the COVID-19 vaccine as of the same week in April 2024 and down from 47.4% for the flu vaccine as of the same week in April 2024. Older adults were most likely to be vaccinated in the 2024-25 season. Among those ages 75 and older, 46.5% got the COVID-19 vaccine and 75.6% got the flu vaccine.
- The District of Columbia had the highest vaccination rate for both. During the 2024-25 season, 42.5% of D.C. adults got the COVID-19 vaccine and 60.3% got the flu shot. Vermont (41.4%) and Massachusetts (36.9%) had the next highest COVID-19 vaccine rates and flipped for flu vaccine rates: 57.5% in Massachusetts and 57.2% in Vermont.
- Louisiana had the lowest COVID-19 vaccination rate, while Florida had the lowest flu vaccination rate. In Louisiana, just 12.5% of adults were vaccinated against COVID-19 during the 2024-25 season. Alabama (12.8%) and Mississippi (13.3%) followed. Meanwhile, Florida (36.1%) had the lowest flu vaccination rate, followed by Wyoming (37.5%) and Nevada (37.6%).
- The COVID-19 vaccination rate grew the most in Maine but fell across Southern states. Between the 2023-24 and 2024-25 seasons, the rate of adults who got COVID-19 vaccines in Maine rose by 6.7 percentage points. Ohio (4.7) and Hawaii (4.5) followed. Vaccine rates fell in six states — all in the South. Alabama led, falling 0.5 percentage points, followed by Arkansas, Florida and Kentucky, tied at a 0.4-point decline each.
- Flu vaccination rates grew or stayed the same in just 15 states. Mississippi (4.5 percentage points), Ohio (3.4) and Washington (3.1) saw the biggest increases in flu vaccine rates between the 2023-24 and 2024-25 seasons. Conversely, Wisconsin saw the biggest drop, at 5.4 percentage points. Virginia (3.8) and Idaho (3.4) followed.
COVID-19, flu vaccination rates similar between 2023-24, 2024-25 seasons
Last season (2024-25), 23.0% of U.S. adults 18 and older got the COVID-19 vaccine, while 46.7% got the flu shot. As of the same week in April 2024, 21.6% of adults had gotten the COVID-19 vaccine, while 47.4% had gotten the flu vaccine. These were only minor variances for each — slightly up for the COVID-19 vaccine, slightly down for the flu shot.
Note: ValuePenguin defined the COVID-19 and flu vaccination seasons using the timing of the vaccine formulations rather than the periods of increased flu or COVID-19 activity and illness. (After all, COVID-19 is a year-round illness.) You can find the exact timing of the seasons we reference throughout this report in the methodology below. Additionally, the latest available data for the 2024-25 season is from April 2025.
In 2025, under the guidance of U.S. Secretary of Health and Human Services Robert F. Kennedy Jr., the official recommendation about who should receive the COVID-19 vaccine was narrowed. The move likely caused some confusion for Americans around getting the vaccine, not only whether they should but also how to do so and whether their insurance would cover it.
Even before the new guidelines, the Trump administration had called the efficacy and safety of the COVID-19 vaccine into question, despite ample scientific evidence that COVID-19 vaccines, including mRNA vaccines, are both safe and effective against the virus. Vaccine skepticism has been on the rise: Nearly a third, or 30%, of Americans expressed their own skepticism in a recent ValuePenguin survey.
Still, older Americans seem more amenable to being vaccinated: During the 2024-25 season, 46.5% of those ages 75 or over got the COVID-19 vaccine, while more than three-quarters (75.6%) got the flu vaccine.
Early in the pandemic, adults older than 65 represented the vast majority (80%) of COVID-19-related hospitalizations. Even today, the CDC says that adults 50 and older are at greater risk for severe complications. Deaths caused by COVID-19 increase dramatically with age, killing hundreds of thousands in older age brackets compared to only tens of thousands in younger demographics.
Additionally, explains ValuePenguin health insurance expert Talon Abernathy, "Medicare may play some role in explaining this discrepancy — if for no other reason than it provides blanket coverage for those 65 and up. In 2023, 12% of those 18 to 34 had no insurance coverage, compared with just 1% of Americans 65 or older. Just having coverage is far more important than the type of coverage you have, generally speaking, because major medical insurance plans have to cover flu and COVID-19 vaccines."
District of Columbia had highest COVID-19, flu vaccination rates
Vaccination rates also varied significantly throughout the country, with certain states having higher-than-average vaccination rates and others seeing a vaccination rate far lower than the national average.
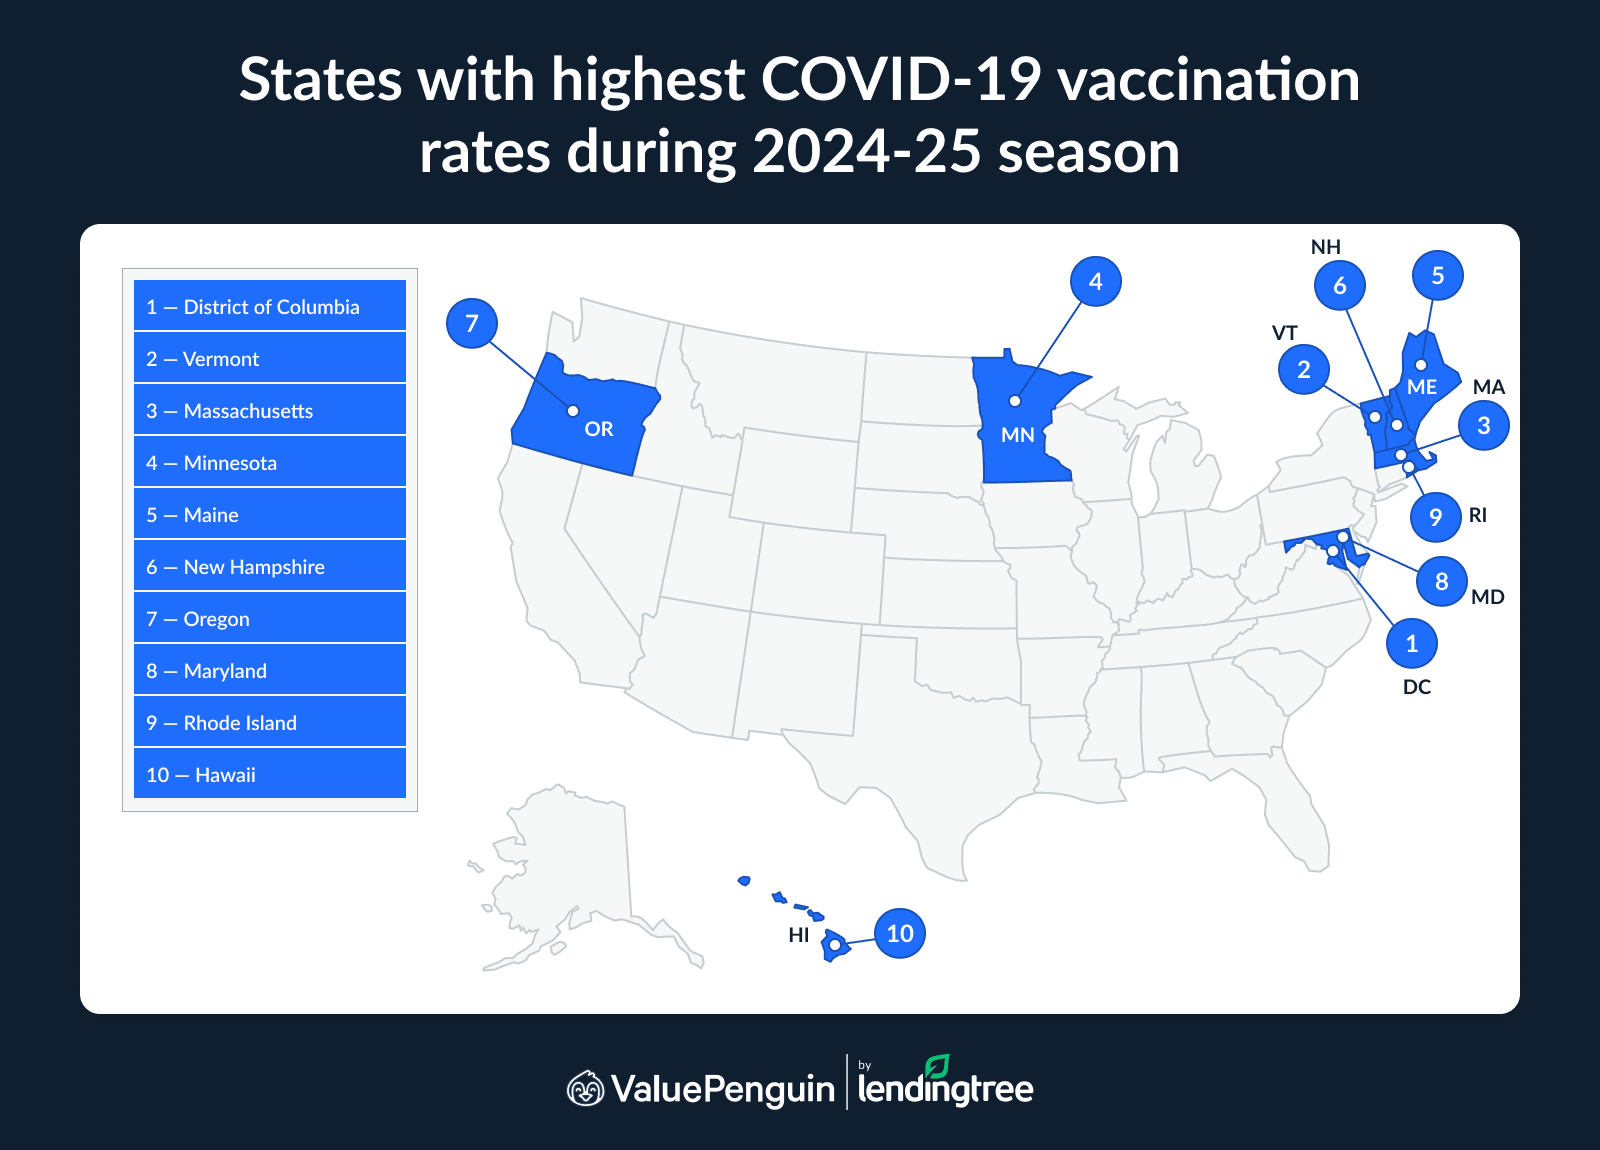
During the 2024-25 season, 42.5% of adults got the COVID-19 vaccine and 60.3% got the flu shot in the District of Columbia, earning it the highest vaccination rate of any state or territory for both vaccines.
Next-highest for COVID-19 vaccination rates were Vermont and Massachusetts, where 41.4% and 36.9% of adults got the shots, respectively. The same two states share the trifecta for flu shot vaccination rates, though they switch places: Massachusetts comes in second at 57.5%, followed closely by Vermont at 57.2%.
Massachusetts was famously the first state in the U.S. to implement a near-universal health care system for its residents in 2006. And in a 2023 survey, 98.3% of Massachusetts residents reported having some form of health insurance. In Vermont, too, the uninsured rate is far lower than the national average, with just 3.4% of its residents lacking coverage (compared with a national average of 7.9%).
Meanwhile, the median household income in D.C. is $108,210, per 2023 Census data — far higher than the national median of $83,730.
Louisiana had lowest COVID-19 vaccination rate, while Florida had lowest flu vaccination rate
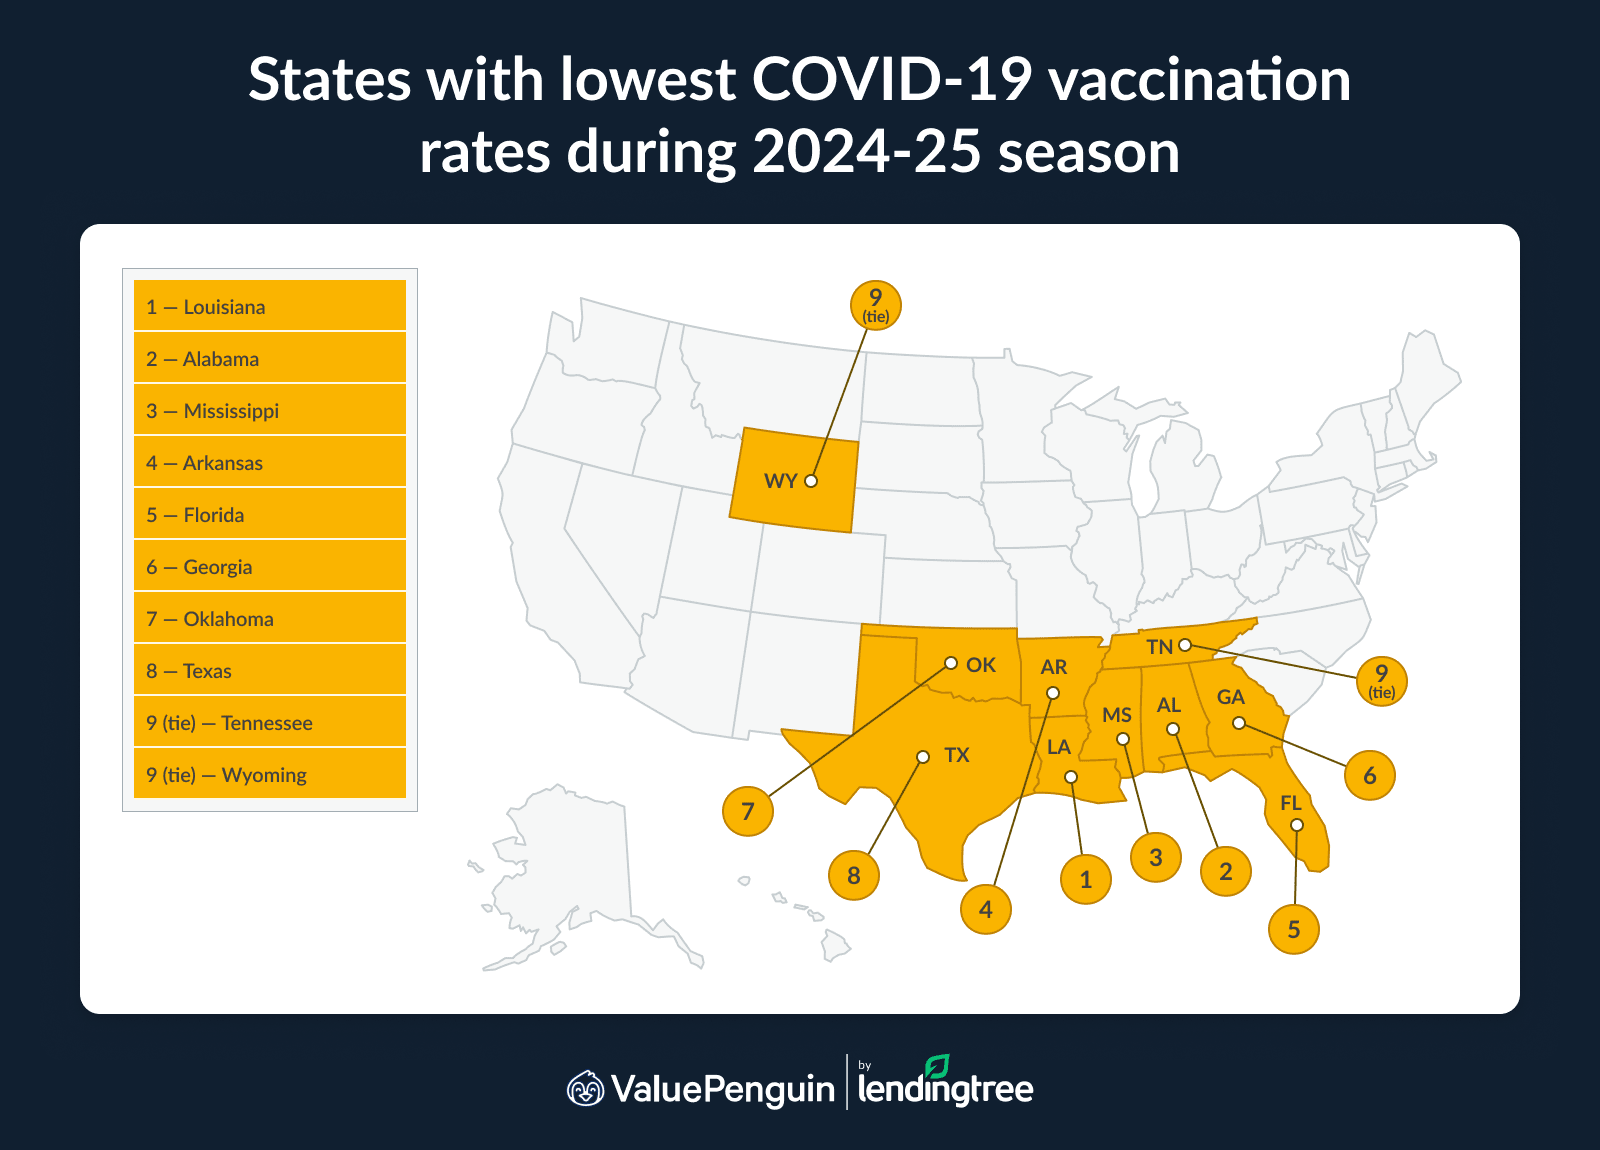
Conversely, the southern U.S. saw lower-than-average vaccine rates for both viruses. During the 2024-25 season, Louisiana had the lowest COVID-19 vaccination rate at just 12.5% — a figure that had fallen from 12.8% during the previous season. Meanwhile, Florida had the lowest flu shot rate last season at 36.1%, which fell from 38.5% the year before. Other states toward the bottom of each list include:
For the COVID-19 vaccine (2024-25 rates):
- Alabama (12.8%)
- Mississippi (13.3%)
- Arkansas (15.4%)
- Florida (15.6%)
- Georgia (15.9%)
For the flu vaccine (2024-25 rates):
- Wyoming (37.5%)
- Nevada (37.6%)
- Idaho (38.3%)
- Georgia (38.6%)
- Alabama (39.1%)
Lack of access may be part of the picture for residents of these states, explains Abernathy, who points out that many of these states don’t have expanded Medicaid. "That means you can't get Medicaid in Alabama, Mississippi, Florida or Wyoming unless you earn a low income and you meet a secondary requirement, such as being pregnant or disabled," he explains.
Additionally, says Abernathy, "Residents of those states may not have access to any form of cheap insurance because Affordable Care Act (ACA) subsidies are only available to those making 138% of the federal poverty line (FPL) or more."
Finally, notes Albernathy, it’s critical to consider factors like race, income and immigration status in these areas. "More than half of all African Americans live in the South, where vaccination rates lag the national average," he says. "It's important to note that African Americans and Hispanic Americans are significantly more likely to be uninsured than white Americans."
Full rankings: States with highest/lowest COVID-19 vaccination rates during 2024-25 season
Rank | State | COVID-19 vaccination rates |
|---|---|---|
| 1 | District of Columbia | 42.5% |
| 2 | Vermont | 41.4% |
| 3 | Massachusetts | 36.9% |
| 4 | Minnesota | 36.8% |
| 5 | Maine | 36.2% |
| 6 | New Hampshire | 32.6% |
| 7 | Oregon | 32.3% |
| 8 | Maryland | 31.0% |
| 9 | Rhode Island | 30.2% |
| 10 | Hawaii | 29.8% |
| 11 | Colorado | 29.1% |
| 12 | New Mexico | 28.9% |
Source: ValuePenguin analysis of the Centers for Disease Control and Prevention (CDC) weekly COVID-19 vaccine dashboard. Note: Data on the 2024-25 COVID-19 season covers the week ending Sept. 7, 2024, through the week ending April 26, 2025.
Full rankings: States with highest/lowest flu vaccination rates during 2024-25 season
Rank | State | Flu vaccination rates |
|---|---|---|
| 1 | District of Columbia | 60.3% |
| 2 | Massachusetts | 57.5% |
| 3 | Vermont | 57.2% |
| 4 | Rhode Island | 55.8% |
| 5 | Maine | 55.6% |
| 6 | Connecticut | 55.1% |
| 7 | New Hampshire | 54.7% |
| 8 | Hawaii | 54.4% |
| 9 | Maryland | 54.2% |
| 10 | Minnesota | 53.4% |
| 11 | Washington | 52.8% |
| 12 | Delaware | 51.2% |
Source: ValuePenguin analysis of the CDC weekly flu vaccine dashboard. Note: Data on the 2024-25 flu season covers the week ending Aug. 24, 2024, through the week ending April 26, 2025.
COVID-19 vaccination rates fell across South
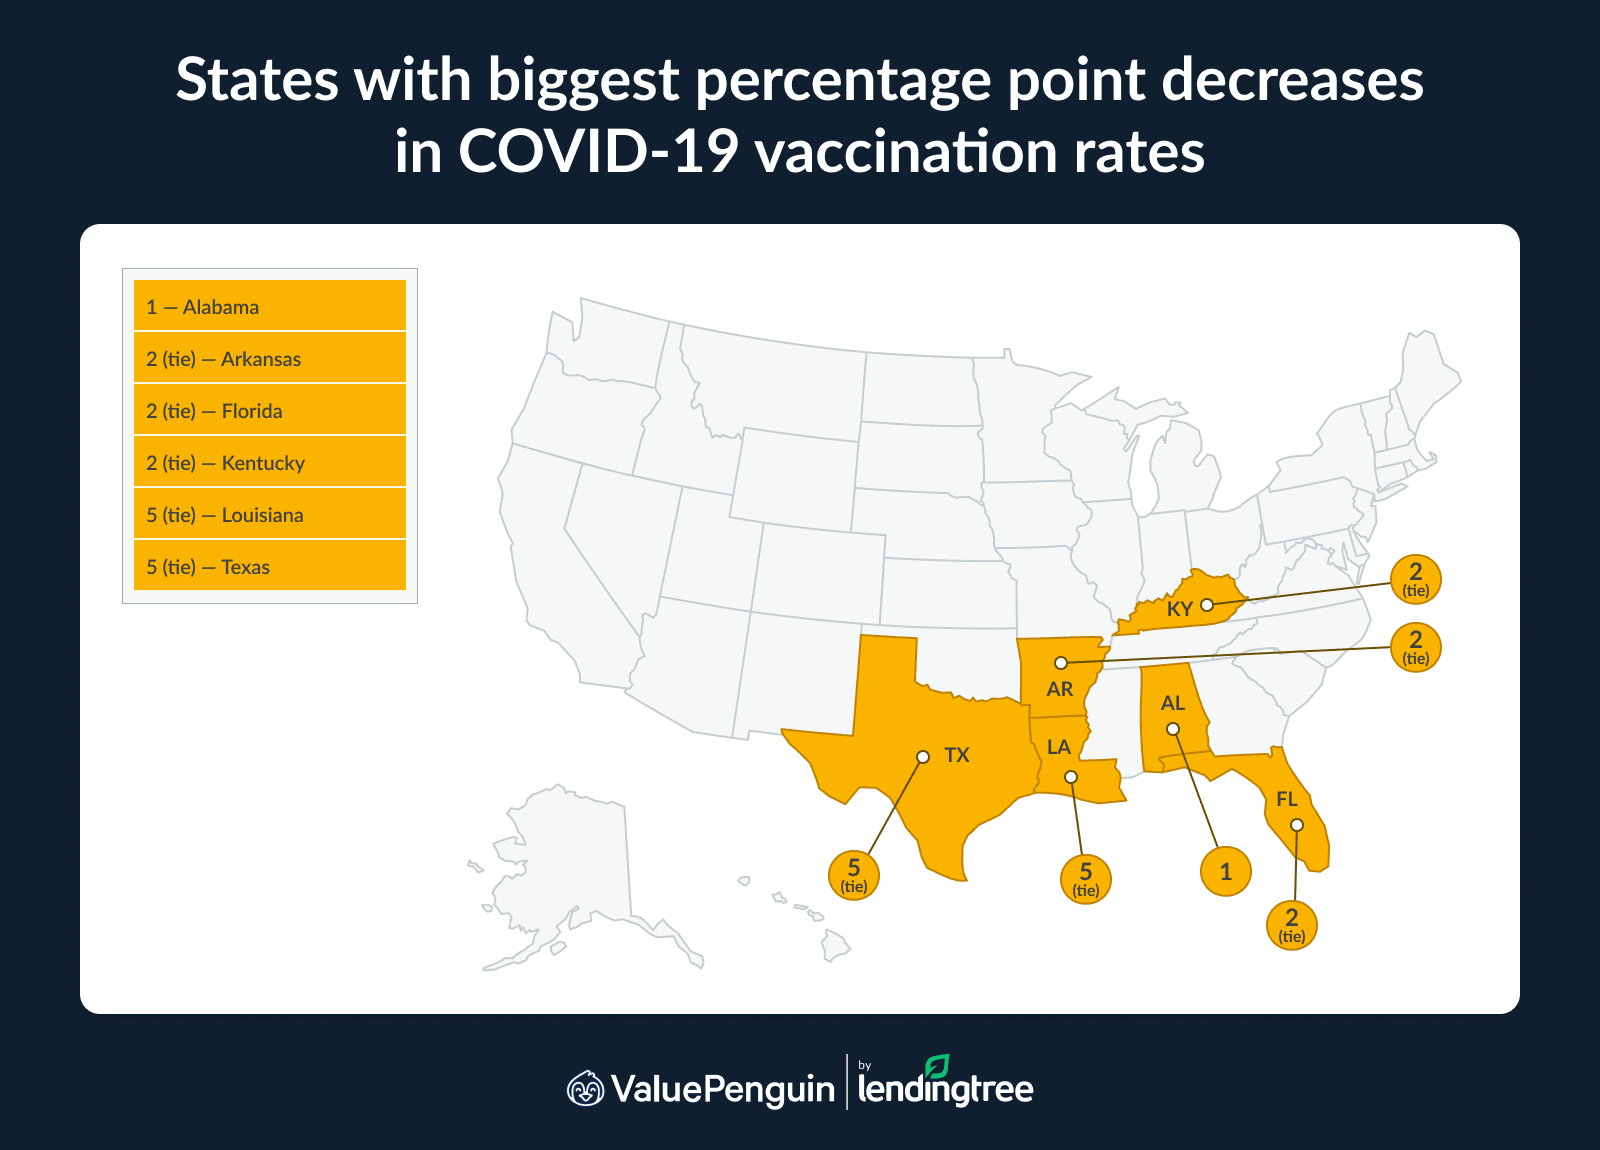
Not only were COVID-19 vaccination rates relatively low across the American South — they also fell year-over-year in many cases. In fact, COVID-19 vaccination rates fell in only six states, all of which are in the South:
- Alabama (-0.5 percentage points)
- Arkansas (-0.4)
- Florida (-0.4)
- Kentucky (-0.4)
- Texas (-0.3)
- Louisiana (-0.3)
At the other end of the spectrum, Maine led with a COVID-19 vaccination rate increase of 6.7 percentage points, followed by Ohio (4.7 points) and Hawaii (4.5).
Along with the access issues in Southern states outlined, Abernathy points out that Maine moved to eliminate nonmedical vaccination exemptions in 2019, which could account at least in part for its rise in vaccination rates.
But that dynamic also "highlights the importance of policy decisions at the state level," Abernathy explains. "At the opposite end of the spectrum, Florida Gov. Ron DeSantis has been an outspoken critic of the COVID-19 vaccine and other preventive measures for controlling communicable diseases, such as mask mandates and limitations on public gatherings during the COVID-19 pandemic."
Indeed, the Florida state surgeon general, Dr. Joseph Ladapo, recently announced a plan to end vaccine mandates for children.
Full rankings: States with biggest percentage point increases/decreases in COVID-19 vaccination rates
Rank | State | 2023-24 vaccination rate | 2024-25 vaccination rate | % point difference |
|---|---|---|---|---|
| 1 | Maine | 29.5% | 36.2% | 6.7 |
| 2 | Ohio | 20.8% | 25.5% | 4.7 |
| 3 | Hawaii | 25.3% | 29.8% | 4.5 |
| 4 | Iowa | 23.5% | 27.6% | 4.1 |
| 5 | Utah | 20.0% | 24.0% | 4.0 |
| 6 | Massachusetts | 33.2% | 36.9% | 3.7 |
| 6 | Kansas | 20.5% | 24.2% | 3.7 |
| 8 | New Hampshire | 29.3% | 32.6% | 3.3 |
| 8 | New Mexico | 25.6% | 28.9% | 3.3 |
| 10 | Maryland | 27.8% | 31.0% | 3.2 |
| 11 | Minnesota | 33.7% | 36.8% | 3.1 |
| 12 | Oregon | 29.4% | 32.3% | 2.9 |
Source: ValuePenguin analysis of the CDC weekly COVID-19 vaccine dashboard. Note: Data on the 2023-24 COVID-19 season covers the week ending Sept. 30, 2023, though the week ending Aug. 17, 2024, while the 2024-25 season covers the week ending Sept. 7, 2024, through the week ending April 26, 2025.
Flu vaccination rates grew most in Mississippi
Although Southern states did see lower vaccination rates in general, flu vaccine rates grew most precipitously in Mississippi, increasing 4.5 percentage points between the 2023-24 season and the 2024-25 season.
The Magnolia State is followed in this regard by Ohio (where flu vaccination rates grew by 3.4 percentage points) and Washington (3.1). Overall, rates increased or stayed the same in just 15 states, falling in all the rest.
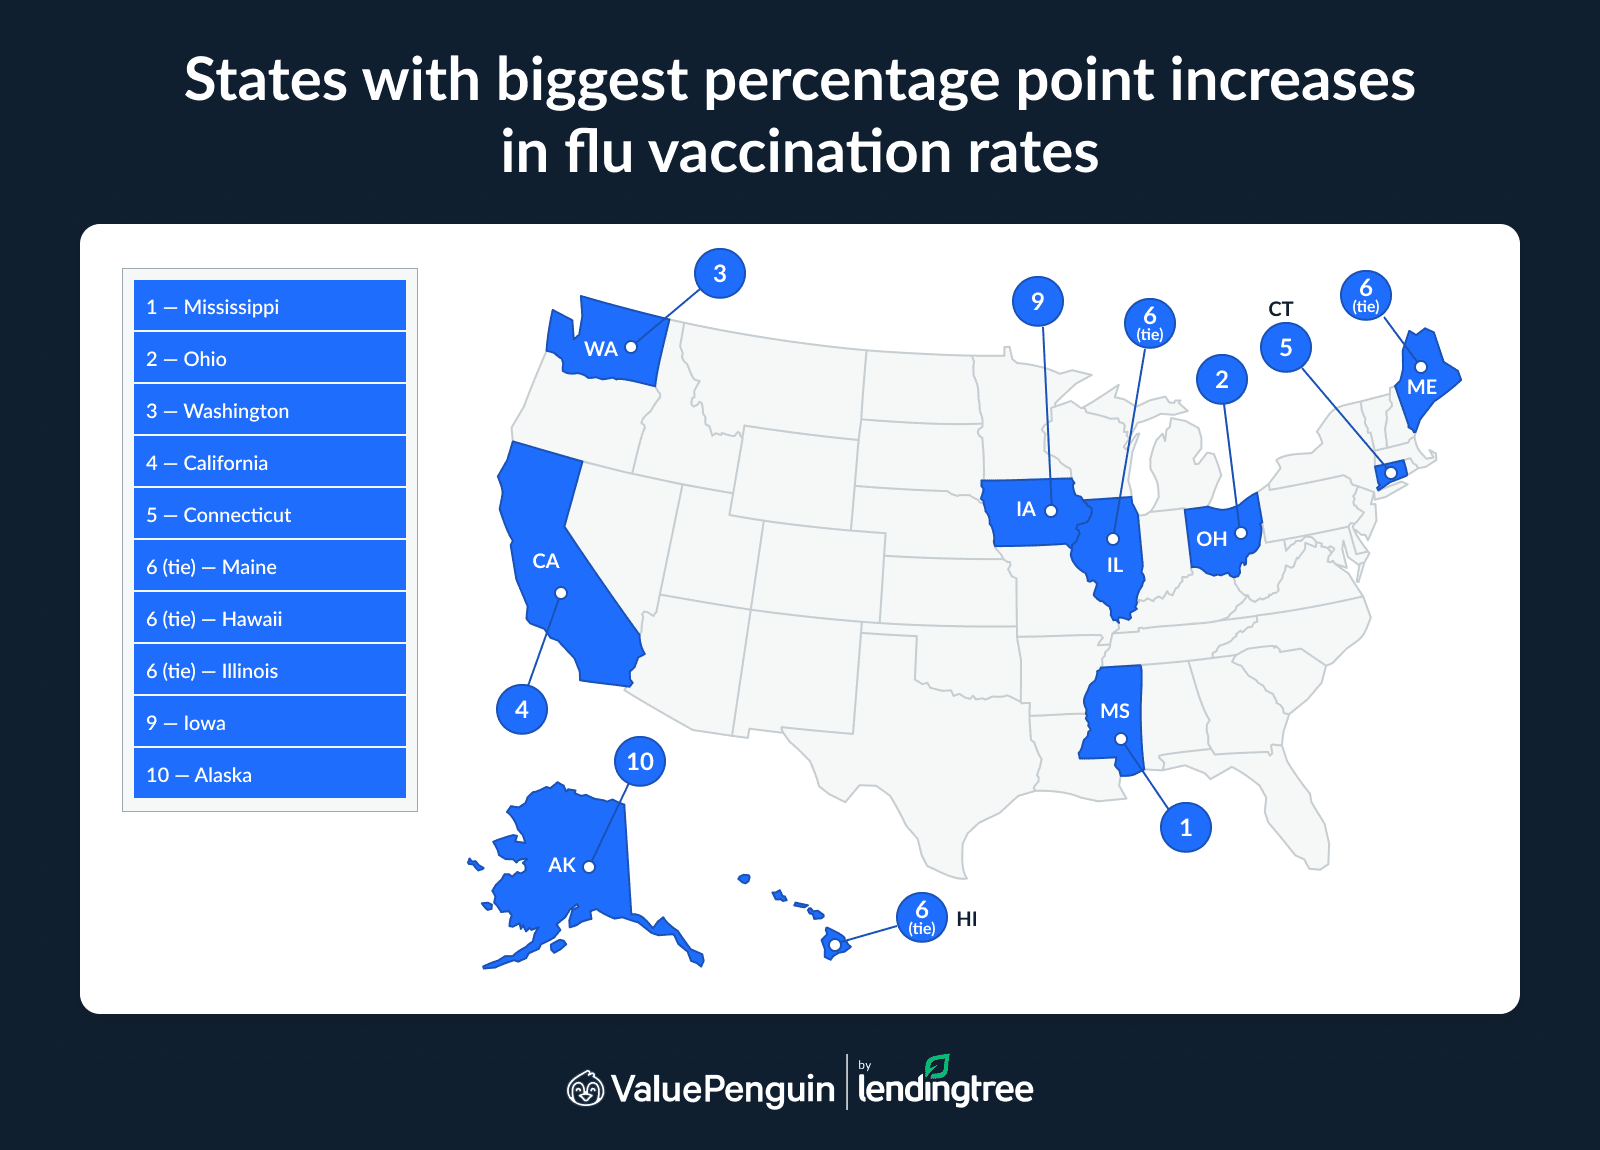
Wisconsin saw the biggest drop in flu vaccination rates at 5.4 percentage points, followed by Virginia (3.8) and Idaho (3.4). Flu vaccination rates remained completely static in New Hampshire, neither rising nor falling. In the Granite State, 54.7% of adults got the flu vaccine in both the studied seasons.
Full rankings: States with biggest percentage point increases/decreases in flu vaccination rates
Rank | State | 2023-24 vaccination rate | 2024-25 vaccination rate | % point difference |
|---|---|---|---|---|
| 1 | Mississippi | 38.3 | 42.8 | 4.5 |
| 2 | Ohio | 47.7 | 51.1 | 3.4 |
| 3 | Washington | 49.7 | 52.8 | 3.1 |
| 4 | California | 48.7 | 50.4 | 1.7 |
| 5 | Connecticut | 53.9 | 55.1 | 1.2 |
| 6 | Maine | 54.7 | 55.6 | 0.9 |
| 6 | Hawaii | 53.5 | 54.4 | 0.9 |
| 6 | Illinois | 49.9 | 50.8 | 0.9 |
| 9 | Iowa | 49.3 | 49.9 | 0.6 |
| 10 | Alaska | 43.5 | 44.0 | 0.5 |
| 11 | District of Columbia | 59.9 | 60.3 | 0.4 |
| 11 | New Jersey | 48.4 | 48.8 | 0.4 |
Source: ValuePenguin analysis of the CDC weekly flu vaccine dashboard. Note: The 2023-24 flu season covers the week ending Sept. 30, 2023, through the week ending June 1, 2024, while the 2024-25 season covers the week ending Aug. 24, 2024, through the week ending April 26, 2025.
Getting jabbed as the flu makes its rounds: Top expert tips
While the new COVID-19 guidelines may be confusing for some, those who still want to be vaccinated against the illness — along with the flu — can find ways to do so. Here are the top tips to get your jabs ahead of the viruses:
- Stay in touch with your provider. While the new guidelines emphasize "informed consent," getting vaccinated can be as simple as having a conversation with your doctor — the sooner you make your appointment, the better. "Vaccine availability may differ depending on factors such as your location, doctor, pharmacist and insurance plan," Abernathy says.
- Consider preexisting conditions that could make your access to the COVID-19 shot easier, such as asthma and other lung conditions, heart conditions and obesity. "Although COVID-19 vaccines should be available to everyone nationwide," says Abernathy, "recent CDC announcements mean you may have a harder time getting the shot if you're otherwise healthy." Still, even without preexisting conditions, you can chat with your doctor if you want the vaccine.
- If you’re having a hard time, consider hitting the road. Laws that govern who is allowed to offer vaccines and in what capacity vary state by state and sometimes even by municipality — a confusion that may have been worsened by the CDC’s official recommendation change. Although it may not be the most convenient option, for some, travel might be worth considering if, in the next town or state over, the vaccine may be more readily available.
- If your insurance plan won’t cover a vaccine, consider drug discount coupons, says Abernathy, like the ones offered through GoodRx, to help lower the price. According to the CDC’s vaccine price list, a single adult dose of the COVID-19 vaccine could cost about $140 or more out of pocket if you don’t have any insurance coverage.
Methodology
ValuePenguin researchers analyzed data from the Centers for Disease Control and Prevention (CDC) weekly COVID-19 and flu vaccine dashboards. The analysis compares data from the most recent vaccination seasons.
The timing of COVID-19 and flu vaccination seasons corresponds to the vaccine formulations for the 2023-24 and 2024-25 vaccination periods, as defined by the CDC.
Data for the COVID-19 seasons is from:
- 2023-24: The week ending Sept. 30, 2023, through the week ending Aug. 17, 2024
- 2024-25: The week ending Sept. 7, 2024, through the week ending April 26, 2025
Data for the flu seasons is from:
- 2023-24: The week ending Sept. 30, 2023, through the week ending June 1, 2024
- 2024-25: The week ending Aug. 24, 2024, through the week ending April 26, 2025
About the Author

Writer, Consumer Research
Maggie Davis is a staff writer at ValuePenguin. She primarily focuses on breaking down complex data and research about the financial lives of Americans into digestible content through our studies and surveys. Her reporting has been featured in numerous publications, such as Forbes and USA Today.
Education
- BA, Journalism, Pepperdine University