
Personal Finance
The Most and Least Affordable Cities for Public Transit
Transit systems across the country are feeling financially squeezed, and many are passing the pain along to riders through fare hikes. New York’s Metropolitan Transit Authority, the nation’s largest system, has just raised the cost of its monthly passes, the second such increase for the city's straphangers in two years. The Metro in D.C. will raise rates on July 1, and some other systems across the country are considering following suit over the course of the year.
In the wake of the increase in New York, where a monthly unlimited pass now costs $121, ValuePenguin analyzed the affordability of more than 70 transit systems across the U.S. Encompassing cities large, small and in-between, our analysis considered not only the cost of fares (actually, we based the calculation on the least-expensive monthly pass) but how deeply that expense cut into the average income of the city’s transit commuters.
Both the cost of passes and incomes ranged widely from city to city, leading to big differences in how much of the average commuter’s paycheck goes towards taking the bus or train to work.
New Yorker commuters pay a lot. They also make a lot.
Despite this month’s hike in costs, New York isn’t the least affordable place to take the bus or train among the cities with the most transit commuters.
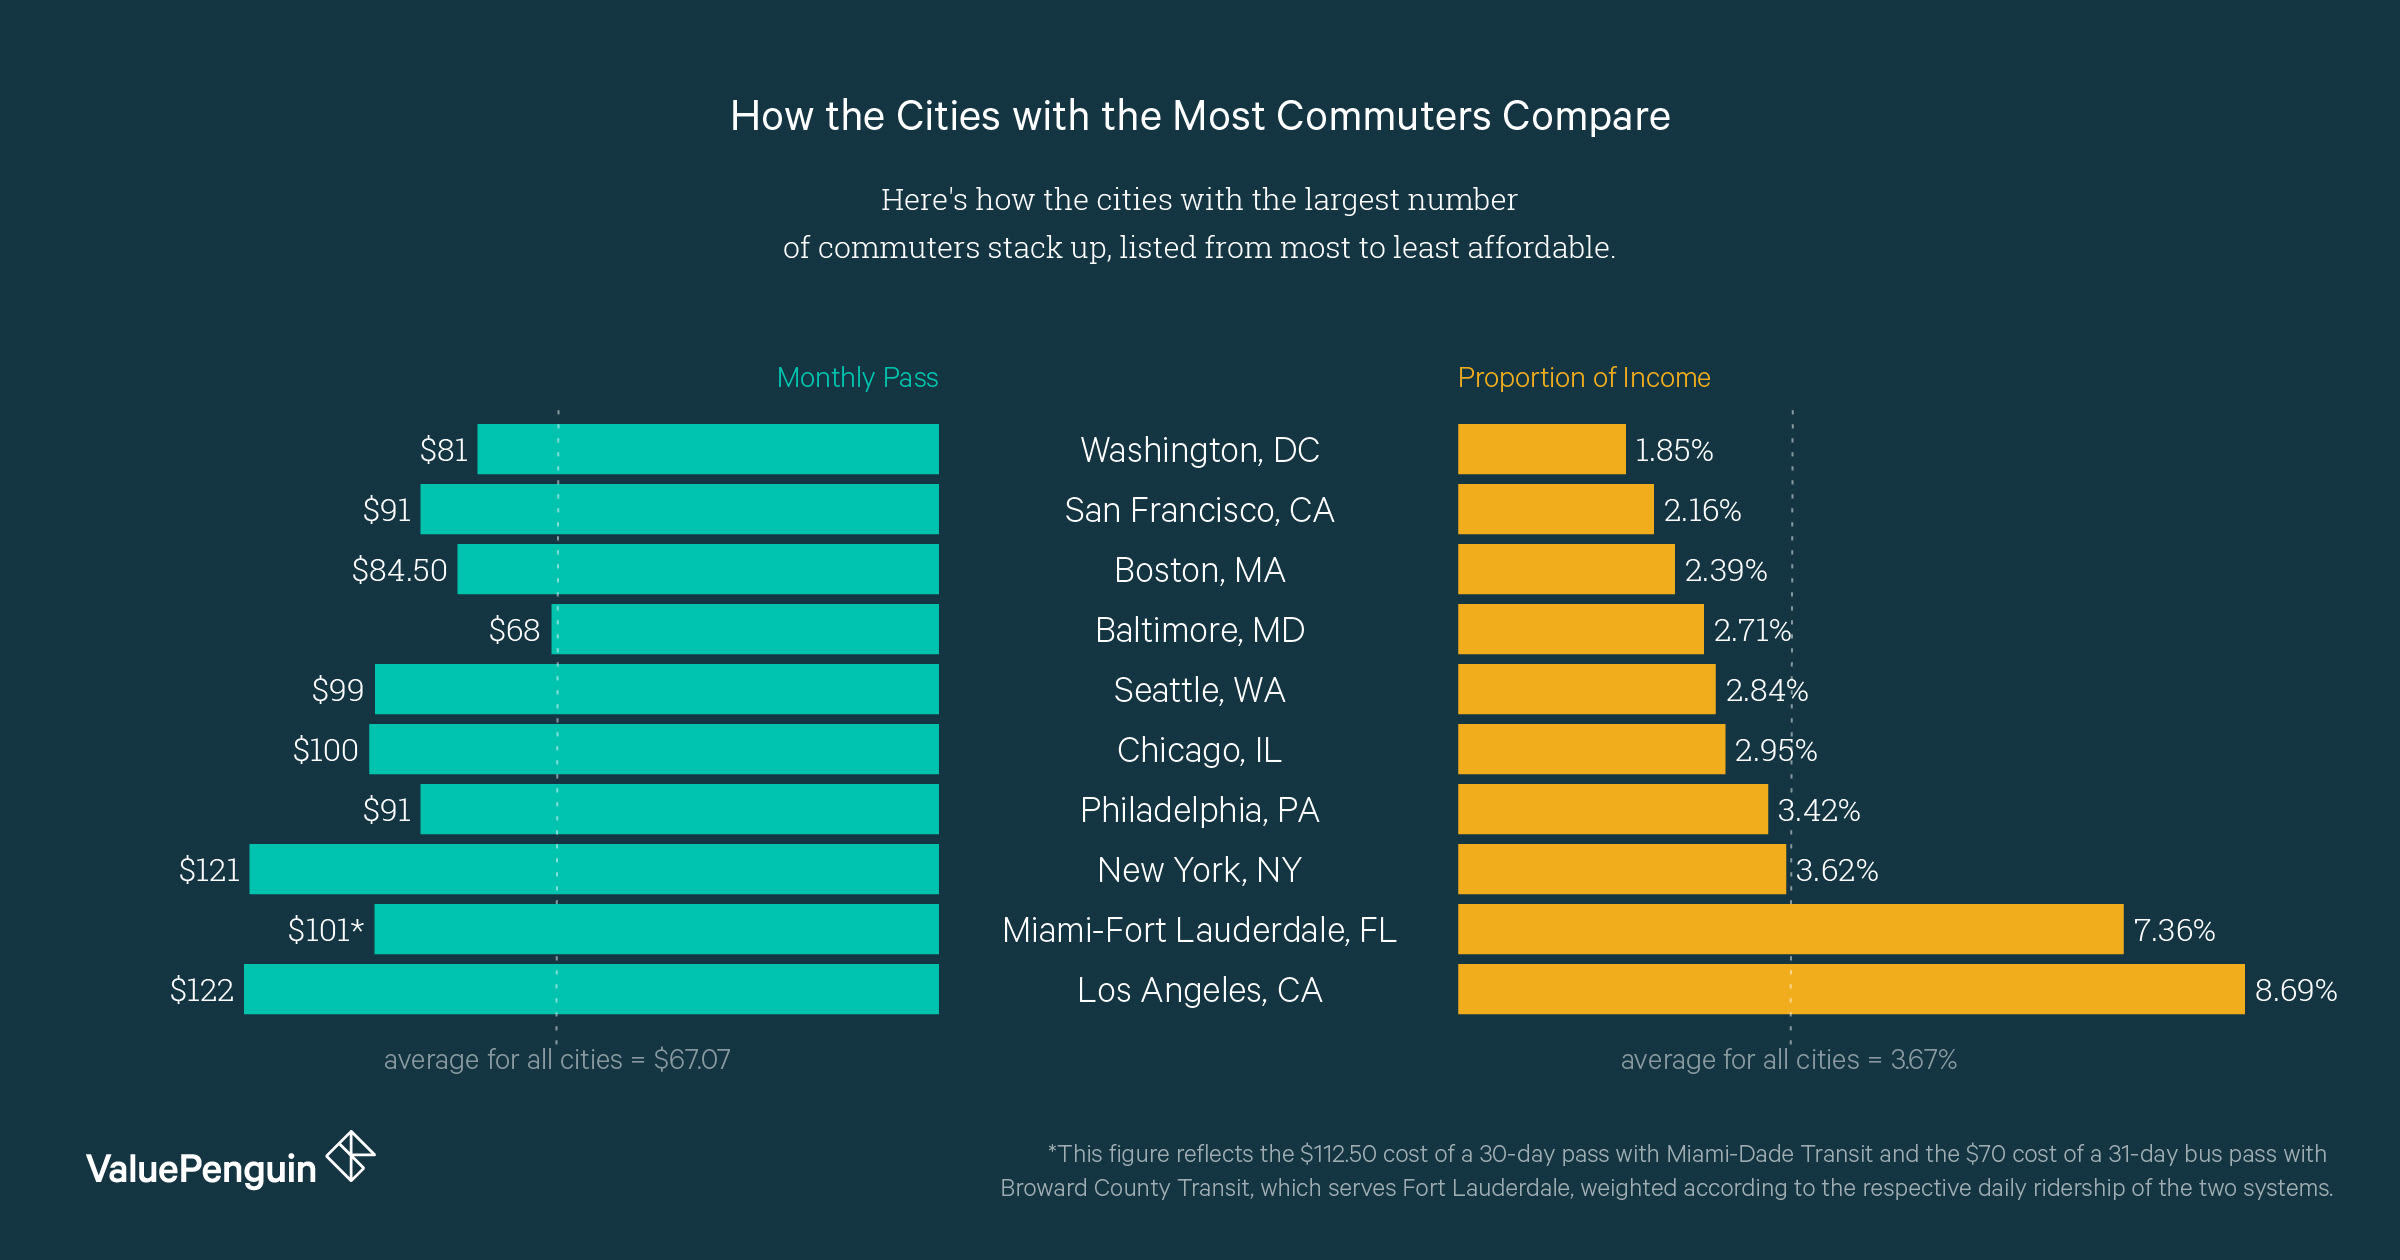
As the chart below reveals, it’s edged out for that dubious distinction by Los Angeles and Miami-Fort Lauderdale, where the least expensive monthly passes ($122 and $101, respectively) are well above the $67 average for all cities and, in both cases, represent more than 7% of the average commuters’ income.
A pass in New York is similarly pricey, but the city’s straphangers have higher incomes than transit commuters in most cities. Consequently, that $121 MTA pass represents only 3.62% of their average monthly income — less than half the bite a pass takes out of a paycheck in Los Angeles and Miami-Fort Lauderdale and only a little above the national average of 3.2%. In affordability, then, New York ranks in the middle of the pack among all the cities we analyzed; see the full list at the bottom of the article.
Where commuting takes the biggest financial bite
There’s no single factor driving why cities made our least-affordable list. As the graphs below (which are organized by city size) reveal, some cities are relatively unaffordable because commuters who make far less than New Yorkers are forced to pay New York-like prices. Examples include Cleveland, Portland, Ore., Atlanta and Denver, where passes cost $100 or close to it. Other cities have below-average costs, but their commuters are notably poor; examples include El Paso, Texas, Springfield, Mass., and Dayton, Ohio.
A note about classifications in the city-size graphs below. Cities are classified by the population living within city limits, which means a few centers where the city itself is notably small but is surrounded by a sprawling metropolitan area may appear to be in the wrong category. (For example, Salt Lake City has a city population of about 150,000 and a metro population of about 1 million.)
Where taking the bus or train is easiest on the pocketbook
In the most affordable cities for commuters overall, riders ponied up between 1% and 2% of their incomes.
Only one big city made the list: Washington, D.C., which is another major center whose consumers are fairly affluent. The top three cities of all for affordability — Bremerton, Wash., Bridgeport, Conn., and Trenton, N.J. — were also fairly wealthy but had relatively moderate costs for passes within the city.
Most of the others in the top 10 for affordability, including Albuquerque, N.M., and Durham N.C., were low to middling in affluence but benefit from passes that cost less than half the national average — generally only $20 to $30 or so.
Most to least affordable cities for commuting by public transit
We looked at data from 73 cities. Where did yours rank?
City | Price, 30-Day Unlimited Pass | Commuters' Median Income | Proportion of Income For Commuting | |
|---|---|---|---|---|
| 1 | Bremerton, WA | $50.00 | $57,902.00 | 1.00% |
| 2 | Bridgeport, CT | $63.00 | $71,694.00 | 1.10% |
| 3 | Trenton, NJ | $54.00 | $51,259.00 | 1.30% |
| 4 | Albuquerque, NM | $30.00 | $23,865.00 | 1.50% |
| 5 | Vallejo-Fairfield, CA | $56.00 | $44,538.00 | 1.50% |
| 6 | Champaign, IL | $20.00 | $13,200.00 | 1.80% |
| 7 | Washington DC | $81.00 | $52,404.00 | 1.90% |
| 8 | Iowa City, IA | $32.00 | $19,362.00 | 2.00% |
| 9 | Durham, NC | $34.00 | $20,393.00 | 2.00% |
| 10 | Ventura, CA | $50.00 | $27,990.00 | 2.10% |
| 11 | San Francisco, CA | $91.00 | $50,501.00 | 2.20% |
| 12 | San Jose, CA | $70.00 | $36,562.00 | 2.30% |
*This figure reflects the $112.50 cost of a 30-day pass with Miami-Dade Transit and the $70 cost of a 31-day bus pass with Broward County Transit, which serves Fort Lauderdale, weighted according to the respective daily ridership of the two systems.
Methodology
We analyzed 73 cities across the U.S., using two factors from 71 different data sources. All cities with over 5,000 workers 16 and older using public transportation (excluding taxicabs) to travel to and from work were included. Seven cities that met this threshold were excluded due to insufficient data sources.
The two factors used to compute our final rankings included the following:
- Median earnings in the past 12 months (in 2015 inflation-adjusted dollars) by workers 16 years and over using public transportation (excluding taxicabs) as means of transportation to work.
- The average of all monthly (30 or 31 days) unlimited use passes for major modes of transportation (excluding taxicabs).
Median earnings in the past 12 months (in 2015 inflation-adjusted dollars) by workers 16 years and over using public transportation (excluding taxicabs) were used in place of median earnings for the entire area because the study was aimed at individuals who use public transportation as a means to get to and from work. The more comprehensive median income would include all other workers that use other means of transportation to get to and from work and would provide less accurate results.
For each city, we researched the monthly unlimited pass cost for each major mode of public transportation offered. Monthly passes were either 30 or 31 days in length. As most cities offered several different options based on route selections, we chose the least expensive option that served the most central areas of the city to use for our study.
We considered averaging the cost of all zones offered, though, this would skew the data in cities that offered public transportation to more rural areas. In some cities, there were multiple major modes of public transportation. In these cities, we averaged the pass costs of each mode to use in our final calculations.
The monthly pass average for each city was calculated as a percentage of the median income value. This allowed us to account for cities with higher prices that were compensated with higher median incomes. Cities were ranked according to this figure.