Flood Insurance
2025 Flood Insurance Report: New Mexico Sees Largest Policy Growth, Utah Has Biggest Decline
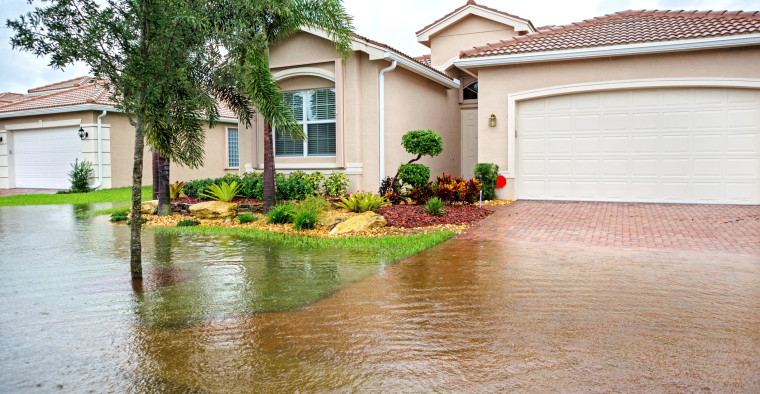
Flooding is the most common disaster in the U.S.
Despite this, the number of active National Flood Insurance Program (NFIP) policies decreased slightly between November 2023 and November 2024. This leaves just an average of 3.3% of households across the U.S. with NFIP coverage, according to the latest ValuePenguin study.
Here’s a closer look.
On this page
- Key findings
- Active flood insurance policies fall slightly
- Average of 3.3% of households have NFIP coverage
- Average payment for claims: $33,905
- 2017 had highest number of paid flood claims
- Policies outside high flood-risk zones are common — and so are losses
- Flood insurance: Top expert tips
- Methodology
Key findings
- The number of active NFIP policies in the U.S. decreased by 0.2% — or 10,721 — from November 2023 to November 2024. By state, the number of policies surged the most (25.4%) in New Mexico. Alaska (21.0%) and Maine (18.5%) followed. Policies decreased the most in Utah (37.5%), North Dakota (10.1%) and West Virginia (7.6%).
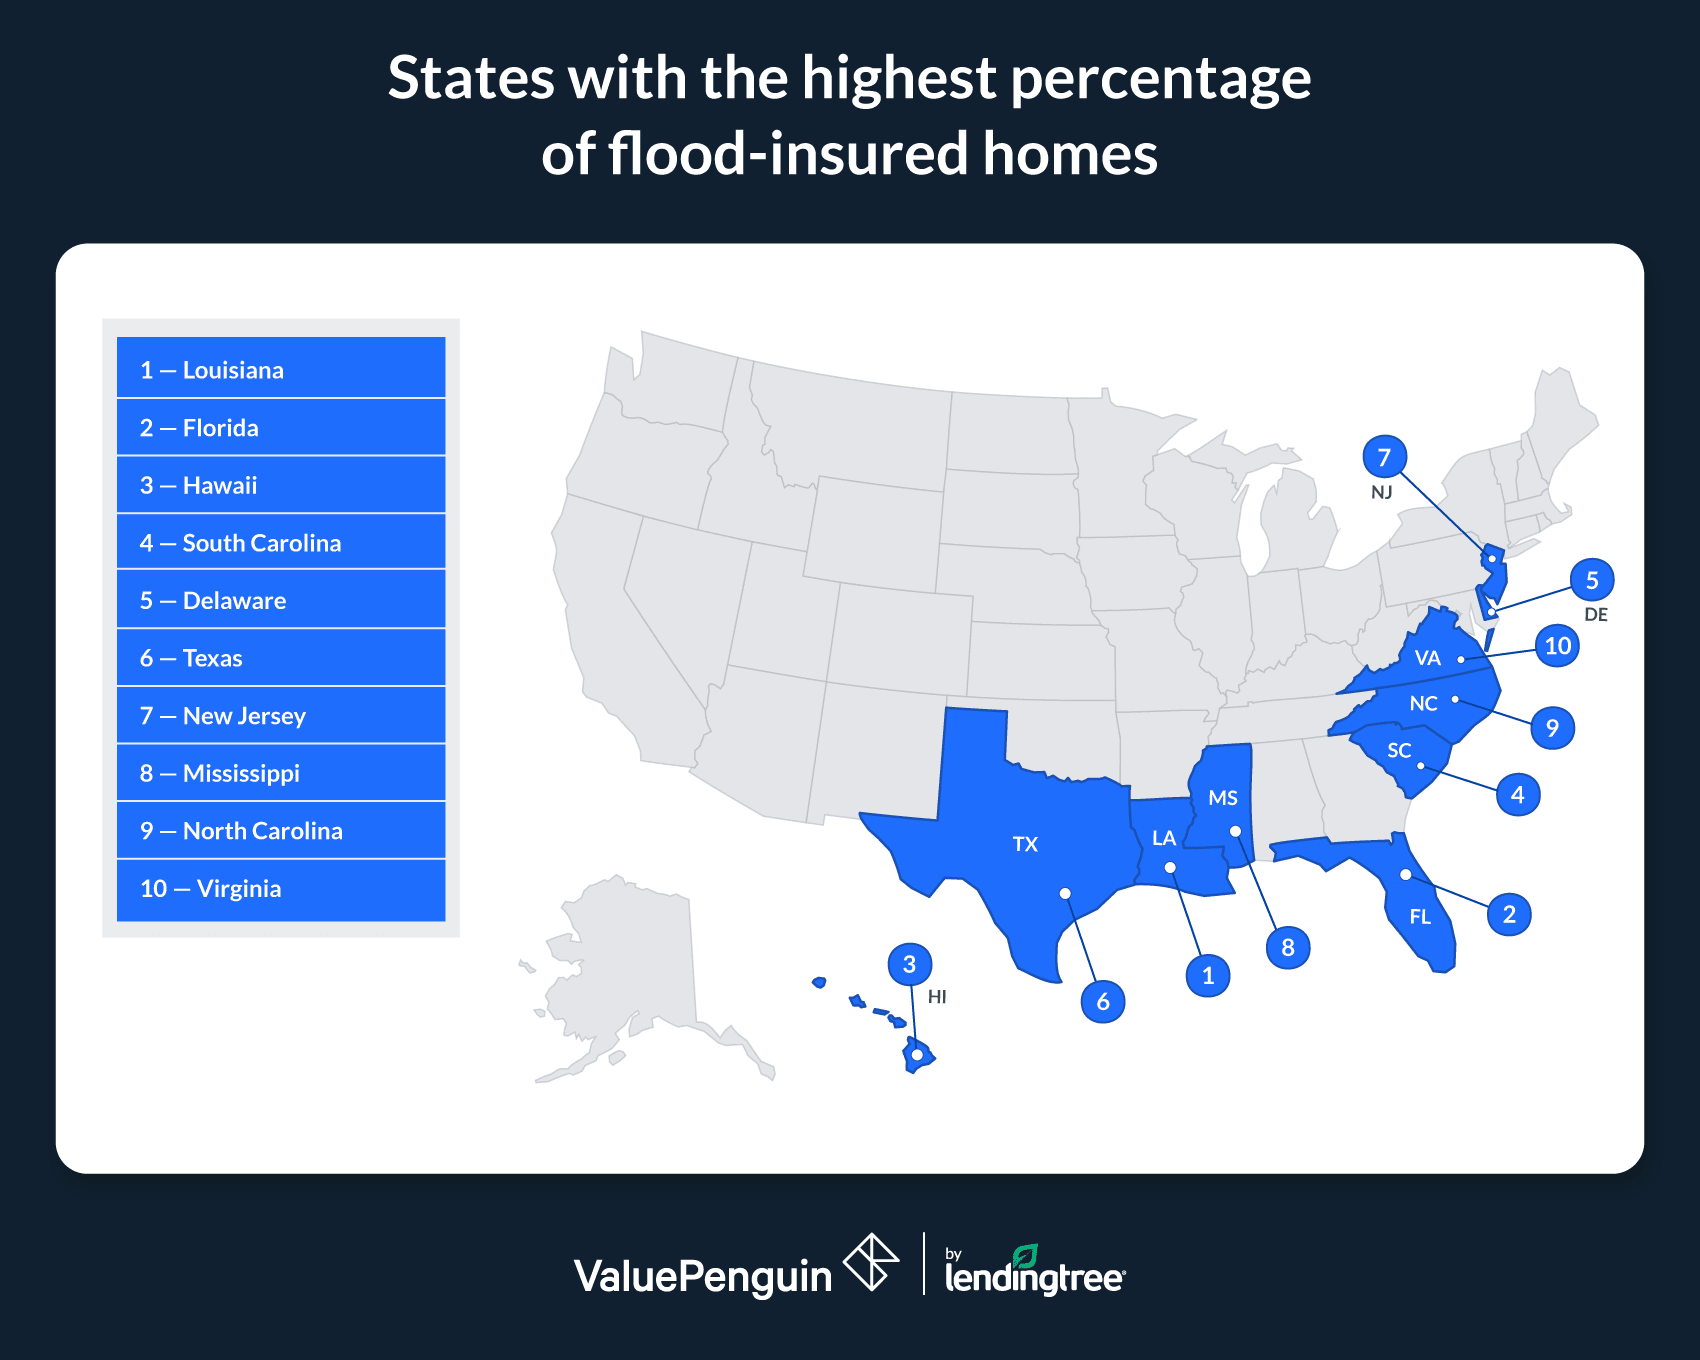
- An average of only 3.3% of households (or about 4.7 million total) across the country have NFIP coverage. Less than 1.0% of homes in 26 states have this flood insurance. Louisiana (20.9%) has the highest percentage of homes with NFIP coverage, ahead of Florida (17.9%) and Hawaii (10.8%).
- As of Nov. 30, nearly 99,000 NFIP claims were filed in 2024 — 74,272 of which were paid. The average payment per claim was $33,905. Hurricanes Helene and Milton caused the most significant flood losses in 2024, with the average payment for Florida claims related to Hurricane Helene being $38,970 (totaling $1.6 billion).
- Over the past decade, 2017 had the highest number of paid NFIP claims and the largest total amount disbursed, mostly due to major hurricanes. Most recently, the number of paid claims dropped 64.8% from 2022 (46,527) to 2023 (16,392). Notably, more than half of claims (51.5%) in 2023 were paid to Florida residents.
- An average of 39.1% of NFIP policies across the U.S. are in areas not considered high flood-risk zones, and these areas account for 30.6% of reported losses. The states with the highest percentage of losses outside these zones are the District of Columbia (85.6%), Utah (81.3%) and Wyoming (61.6%).
Active flood insurance policies fall slightly
Between November 2023 and November 2024, the number of flood insurance policies in force (meaning active) fell by 10,721, or 0.2%.
By state, New Mexico had the biggest surge, adding 2,616 active policies — a jump of 25.4%. This comes amid a severe storm that caused widespread flooding in New Mexico in October 2024, leading to a federal disaster declaration.
ValuePenguin home insurance expert Divya Sangameshwar says other disasters have also contributed to rising enrollment here.
"New Mexico’s increase in flood insurance enrollment can be attributed to the Federal Emergency Management Agency (FEMA) offering five years of flood insurance coverage for homes that weren’t required to carry it in areas affected by the Hermits Peak-Calf Canyon fire," she says. "This raises awareness of the importance of protection against flooding."
States with biggest percentage increases in active NFIP policies
Rank | State | # of policies, Nov. 2023 | # of policies, Nov. 2024 | # difference | % difference |
|---|---|---|---|---|---|
| 1 | New Mexico | 10,282 | 12,898 | 2,616 | 25.4% |
| 2 | Alaska | 2,327 | 2,816 | 489 | 21.0% |
| 3 | Maine | 7,234 | 8,572 | 1,338 | 18.5% |
Source: ValuePenguin analysis of National Flood Insurance Program (NFIP) data.
Alaska and Maine followed with increases of 21.0% and 18.5%, respectively. Like New Mexico, both states experienced significant flooding in 2024, with Maine experiencing back-to-back winter storms that January and Alaska experiencing flooding along the Mendenhall River in August due to a glacial outburst (a climate-driven release of water that is dammed up by a glacier suddenly giving way).
Conversely, NFIP policies decreased the most in Utah at 37.5%. North Dakota (10.1%) and West Virginia (7.6%) followed.
Full rankings
States with biggest percentage increases/decreases in active NFIP policies
Rank | State | # of policies, Nov. 2023 | # of policies, Nov. 2024 | # difference | % difference |
|---|---|---|---|---|---|
| 1 | New Mexico | 10,282 | 12,898 | 2,616 | 25.4% |
| 2 | Alaska | 2,327 | 2,816 | 489 | 21.0% |
| 3 | Maine | 7,234 | 8,572 | 1,338 | 18.5% |
| 4 | Vermont | 3,283 | 3,886 | 603 | 18.4% |
| 5 | Hawaii | 55,700 | 60,615 | 4,915 | 8.8% |
| 6 | New Hampshire | 7,250 | 7,596 | 346 | 4.8% |
| 7 | Florida | 1,713,619 | 1,770,988 | 57,369 | 3.3% |
| 8 | District of Columbia | 2,312 | 2,384 | 72 | 3.1% |
| 9 | Massachusetts | 55,863 | 56,804 | 941 | 1.7% |
| 10 | Rhode Island | 11,373 | 11,516 | 143 | 1.3% |
| 11 | Iowa | 9,771 | 9,892 | 121 | 1.2% |
| 12 | Michigan | 19,521 | 19,708 | 187 | 1.0% |
Source: ValuePenguin analysis of NFIP data.
Average of 3.3% of households have NFIP coverage
In total, just 3.3% of households on average across the U.S. have NFIP coverage. That’s only about 4.7 million homes. Sangameshwar says this is concerning.
"Climate change continues to drive sea-level increases and make weather more extreme," she says. "As a result, flood-prone areas around the country are expected to grow by nearly half in just this century. Two years of back-to-back decreases in active flood insurance policies indicates that many homeowners aren’t fully aware of the growing risks of flooding."
Flood insurance isn’t mandatory (in most cases) unless your home is in a special flood hazard area (SFHA), so homeowners may find it easier to cut back on flood insurance to manage their rising insurance costs. "Sadly, this means many homeowners are putting themselves at significant financial risk from future flood damages — especially when just one inch of flood water can cause $25,000 in damage."
Unsurprisingly, coastal states have the highest percentage of homes with NFIP coverage. Louisiana (20.9%) leads, while Florida (17.9%) and Hawaii (10.8%) follow.
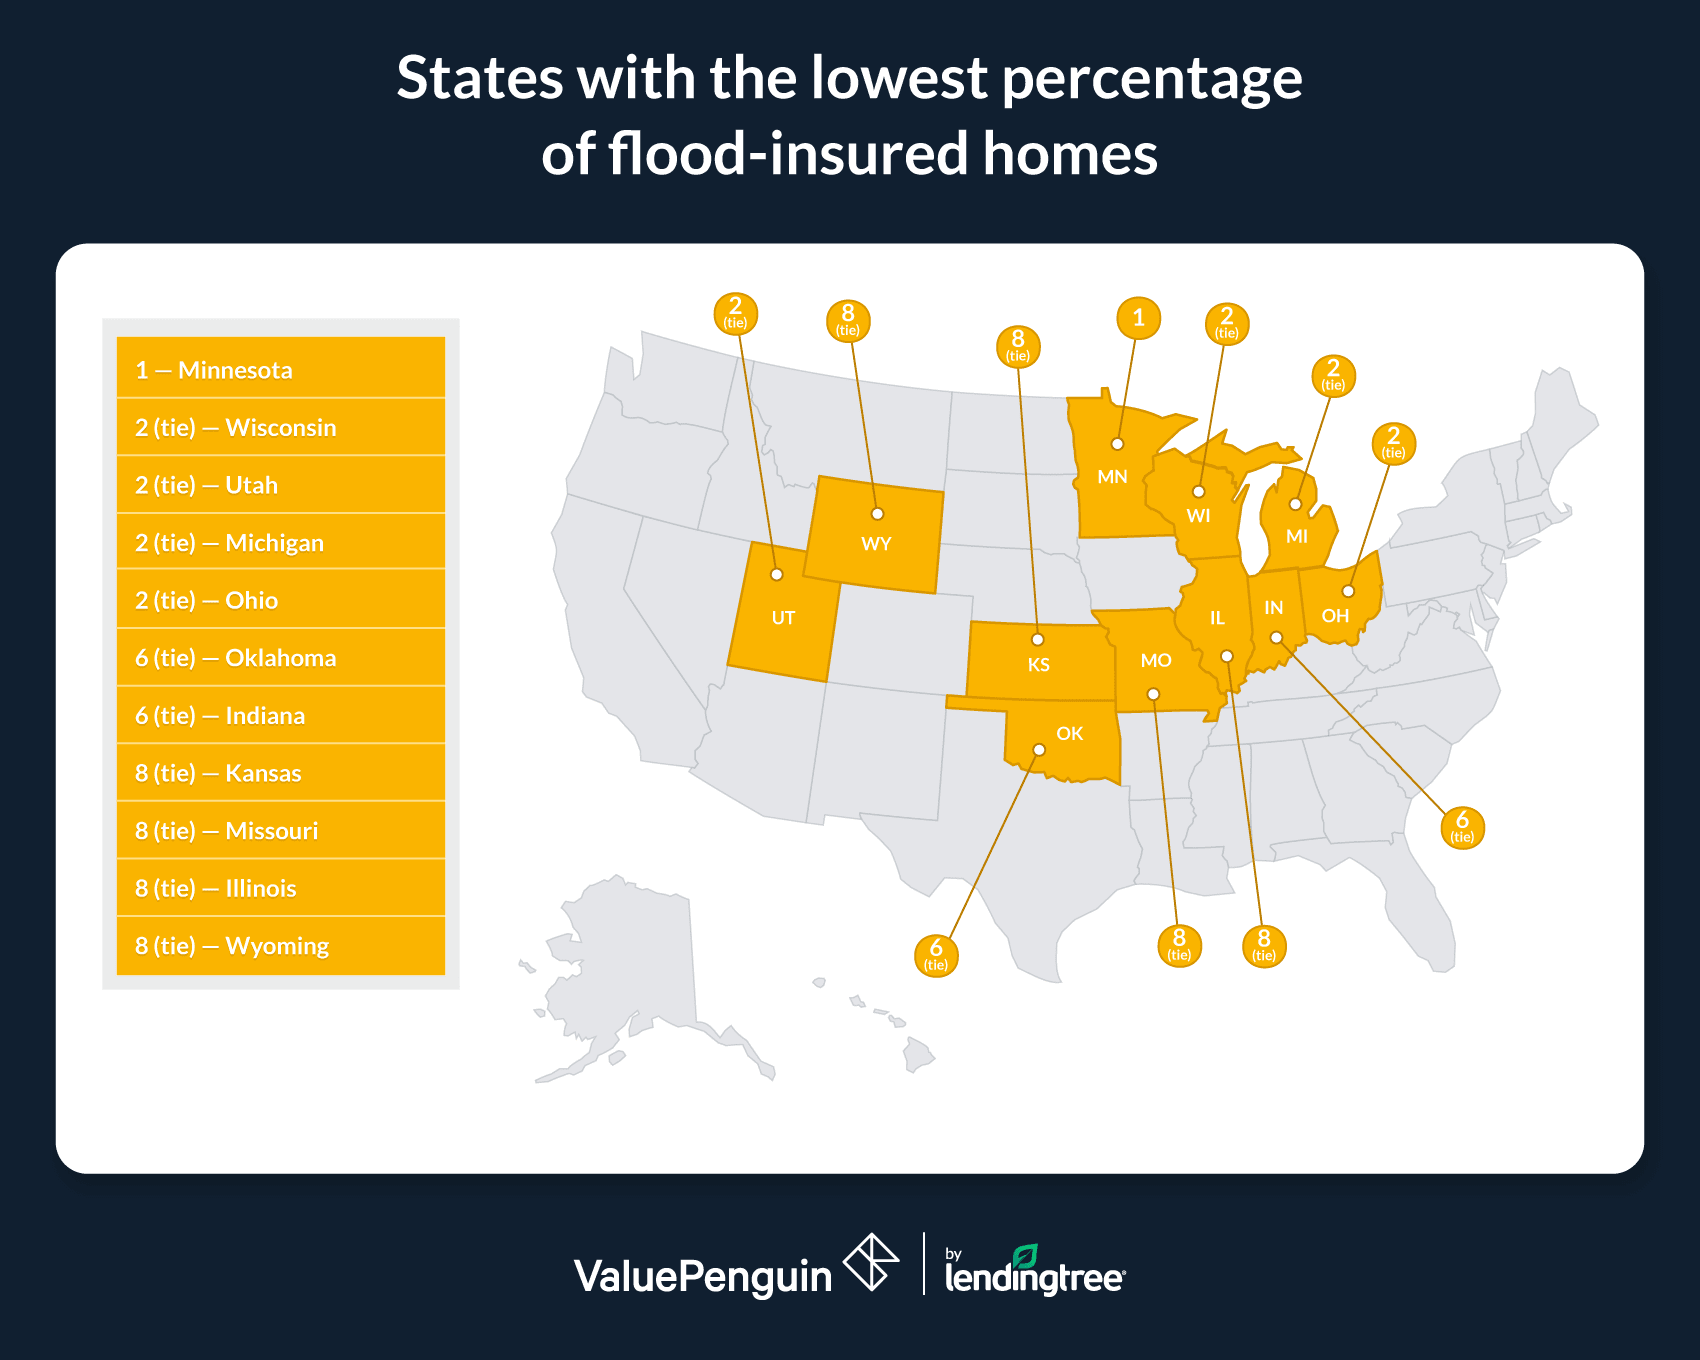
Conversely, less than 1.0% of homes in 26 states have NFIP coverage. Minnesota (0.3%) leads here, with four states tying for second at 0.4%: Wisconsin, Utah, Michigan and Ohio.
Climate change means extreme rainfall is becoming more common across the U.S., particularly in the Midwest — meaning flood insurance may be more necessary than homeowners in these states believe.
Looking at average annual flood insurance costs, West Virginia ranks first, at $1,450. Connecticut ($1,306) and Kentucky ($1,272) follow. Meanwhile, flood insurance costs the least in the District of Columbia ($502), Utah ($658) and Maryland ($682).
Full rankings
States with highest/lowest percentage of NFIP coverage
Rank | State | Homes | # of policies, Nov. 2024 | % with flood insurance | Avg. annual cost of flood insurance |
|---|---|---|---|---|---|
| 1 | Louisiana | 2,080,371 | 434,853 | 20.9% | $759 |
| 2 | Florida | 9,915,957 | 1,770,988 | 17.9% | $853 |
| 3 | Hawaii | 560,873 | 60,615 | 10.8% | $792 |
| 4 | South Carolina | 2,362,253 | 198,606 | 8.4% | $751 |
| 5 | Delaware | 451,556 | 25,915 | 5.7% | $929 |
| 6 | Texas | 11,654,971 | 639,256 | 5.5% | $791 |
| 7 | New Jersey | 3,756,340 | 200,764 | 5.3% | $1,247 |
| 8 | Mississippi | 1,324,992 | 52,820 | 4.0% | $847 |
| 9 | North Carolina | 4,739,881 | 131,308 | 2.8% | $916 |
| 10 | Virginia | 3,625,285 | 92,562 | 2.6% | $1,166 |
| 11 | Maryland | 2,531,075 | 63,194 | 2.5% | $682 |
| 12 | Rhode Island | 483,053 | 11,516 | 2.4% | $991 |
Source: ValuePenguin analysis of NFIP and U.S. Census Bureau data. Note: Policy, percentage and cost figures are all for NFIP coverage.
Average payment for claims: $33,905
Looking closely at the majority of 2024, 98,667 NFIP claims were filed as of Nov. 30. Of these, 74,272 were paid out. The average payment per claim was $33,905.
NFIP claims by the numbers, 2024 | |
|---|---|
| # of claims | 98,667 |
| # of paid claims | 74,272 |
| Avg. pay per claim | $33,905 |
| Total paid claims ($) | $2,518,201,225 |
Source: ValuePenguin analysis of NFIP data. Note: Data is as of Nov. 30, 2024.
Hurricanes Helene and Milton caused the most significant flood losses in 2024. Residents across seven states — Florida, Georgia, Kentucky, North Carolina, South Carolina, Tennessee and Virginia — received claim payments. Of these, Florida residents affected by Hurricane Helene received the highest average claim, at $38,970 (for a total of $1.6 billion). Comparatively, the average claim for Hurricane Helene by state was:
- North Carolina: $23,757
- Tennessee: $23,500
- Georgia: $14,538
- Virginia: $14,426
- South Carolina: $11,515
Florida also received the highest average claim for Hurricane Milton damage, at $17,269.
Sangameshwar says more natural disasters and flooding will ultimately increase home insurance rates because they increase the cost of repairs and the risk of future losses.
"While home insurers don’t cover flood damages, from an insurance company’s perspective, a rise in flooding and flood risk will raise their reinsurance premiums," she says. "Flood insurance also takes a big hit from an increase in flood-related disasters. However, with NFIP policies, rate increases won’t be dramatic in areas where flood risk has gone up significantly due to the agency’s concerns over affordability."
2017 had highest number of paid flood claims
Looking at the decade from 2014 to 2023, the highest number and total dollar amount of NFIP paid claims occurred in 2017, at 112,385 paid claims for a total of $10.6 billion.
That’s largely due to major hurricanes, with Hurricane Harvey and Hurricane Irma occurring that year. Hurricane Harvey resulted in 92,390 paid losses for a total of $9.0 billion, while Hurricane Irma resulted in 33,337 paid losses for a total of $1.1 billion. (Note: The hurricane-specific figures are based on the event rather than the year, so the number of paid claims in 2017 is lower than the sum from the two storms. Some of these claims would have ultimately been paid the following year.)
Average payments per flood insurance claim by year
Year | # of paid claims | Total in paid claims ($) | Average pay per claim |
|---|---|---|---|
| 2014 | 12,948 | $381,386,749 | $29,455 |
| 2015 | 25,997 | $1,043,928,137 | $40,156 |
| 2016 | 70,250 | $4,458,784,525 | $63,470 |
| 2017 | 112,385 | $10,645,180,947 | $94,721 |
| 2018 | 33,469 | $1,553,984,349 | $46,431 |
| 2019 | 29,083 | $1,516,365,554 | $52,139 |
| 2020 | 24,444 | $932,314,623 | $38,141 |
| 2021 | 35,230 | $1,952,858,410 | $55,432 |
| 2022 | 46,527 | $5,099,476,023 | $109,603 |
| 2023 | 16,392 | $967,853,360 | $59,044 |
Source: ValuePenguin analysis of NFIP data. Note: NFIP-paid claims don't include those not covered by insurance or covered by private insurance.
Between 2022 and 2023 (the last year with full data available at the time of research), the number of paid claims dropped by 64.8% from 46,527 to 16,392. Of the claims in 2023, 51.5% were paid to residents of Florida. Florida also received 67.7% of the total amount paid that year.
The most significant flood losses occurred during Hurricane Katrina in 2005, at $16.2 billion. Hurricane Harvey in 2017 ($9.0 billion) and Hurricane Sandy in 2012 ($8.9 billion) followed.
Policies outside high flood-risk zones are common — and so are losses
While those in high flood-risk zones are required to have flood insurance, it’s worth noting that an average of 39.1% of active NFIP policies across the U.S. are in areas not considered a high risk. Also of note, these areas account for an average of 30.6% of reported 2024 losses as of Nov. 30.
The District of Columbia had the highest percentage of losses outside high flood-risk zones at 85.6%, followed by Utah (81.3%) and Wyoming (61.6%).
States with highest percentage of NFIP losses outside high-risk zones
Rank | State | % of policies outside high-risk zones | % of losses outside high-risk zones |
|---|---|---|---|
| 1 | District of Columbia | 70.1% | 85.6% |
| 2 | Utah | 57.6% | 81.3% |
| 3 | Wyoming | 47.0% | 61.6% |
Source: ValuePenguin analysis of NFIP data as of Nov. 30, 2024.
Meanwhile, only 12.0% of losses in New Jersey occurred in low flood-risk areas, followed by Florida (15.6%) and Delaware (16.5%).
Full rankings
States with highest/lowest percentage of NFIP policies outside high-risk zones
Rank | State | % of policies outside high-risk zones | % of losses outside high-risk zones |
|---|---|---|---|
| 1 | District of Columbia | 70.1% | 85.6% |
| 2 | Utah | 57.6% | 81.3% |
| 3 | Wyoming | 47.0% | 61.6% |
| 4 | Montana | 29.4% | 61.4% |
| 5 | South Dakota | 35.9% | 58.5% |
| 6 | North Dakota | 53.2% | 58.3% |
| 7 | Colorado | 47.5% | 54.2% |
| 8 | Texas | 66.8% | 52.2% |
| 9 | Arizona | 30.9% | 51.4% |
| 10 | Maine | 40.1% | 47.1% |
| 11 | Maryland | 55.2% | 45.2% |
| 12 | Idaho | 29.7% | 44.4% |
Source: ValuePenguin analysis of NFIP data as of Nov. 30, 2024.
Flood insurance: Top expert tips
All homeowners should consider their flood risk, Sangameshwar says.
"Recent flood disasters demonstrated that floods don’t just occur in coastal, or low-lying, areas," she says. "Even if flood insurance is only required for a small subsection of homeowners, low flood risk doesn’t mean zero flood risk. And homeowners insurance and renters insurance don’t cover flooding."
Anyone can get flood insurance through an agent or an insurer participating in the NFIP. There are no restrictions on who can purchase a policy, and you don't need to live in a floodplain or high-risk area to get one.
"The good news is that NFIP premiums are the same regardless of the insurer or agent you go through, so you don’t need to shop around for an NFIP policy," Sangameshwar says. "For homeowners, rates are set based on factors such as the value of your property, the year it was built and flood risk. However, you can’t buy coverage beyond what the NFIP offers. In most cases, it covers $100,000 in personal possessions and $250,000 of your home’s value."
For homeowners who want more coverage, private insurers also offer flood insurance policies with higher coverage limits — something that’ll be helpful for higher-value homes that would be expensive to rebuild or repair. While NFIP policies typically require 30-day waiting periods, the waiting period to get covered under private insurance is generally 14 days. However, private flood insurance can be risky. Insurers could drop your coverage in the middle of your term or decline to renew it, leaving you scrambling for a new policy.
Methodology
LendingTree researchers analyzed flood insurance policy and claims data from the National Flood Insurance Program (NFIP), utilizing the most recent available data at the time of research. Policies, claims and financial losses data are as of Nov. 30, 2024. Additionally, historical data on NFIP claims and trends was utilized.
Analysts calculated the percentage of policies and losses in other zones (not high-risk areas) from the total number of policies and losses, using NFIP Policy and Loss Statistics by Flood Zone as of Nov. 30, 2024, aggregated at the state level. High-risk zones, known as special flood hazard areas (SFHAs), include A and V zones designated by FEMA (A, AE, AH, AO, AR, A99, V and VE).
To determine the percentage of homeowners with flood insurance, researchers divided the number of active NFIP policies by the number of housing units, utilizing the U.S. Census Bureau 2022 American Community Survey with five-year estimates.
About the Author

Writer, Consumer Research
Maggie Davis is a staff writer at ValuePenguin. She primarily focuses on breaking down complex data and research about the financial lives of Americans into digestible content through our studies and surveys. Her reporting has been featured in numerous publications, such as Forbes and USA Today.
Education
- BA, Journalism, Pepperdine University